Many thanks to Paul Bradshaw in helping out with this.
Journalists rarely get their hands on nice and tidy data. Public bodies don’t have the interest of providing it structured. It’s a journalist’s job to arrange it before extracting patterns and stories.
In this spreadsheet, I’ll be taking you through how me an Paul cleaned data using OpenRefine.
Importing and preparing
The data I’ll be working with is a list of litter bin locations in Birmingham.

Problems:
- blank cells
- empty columns.
- headers and page numbers repeating
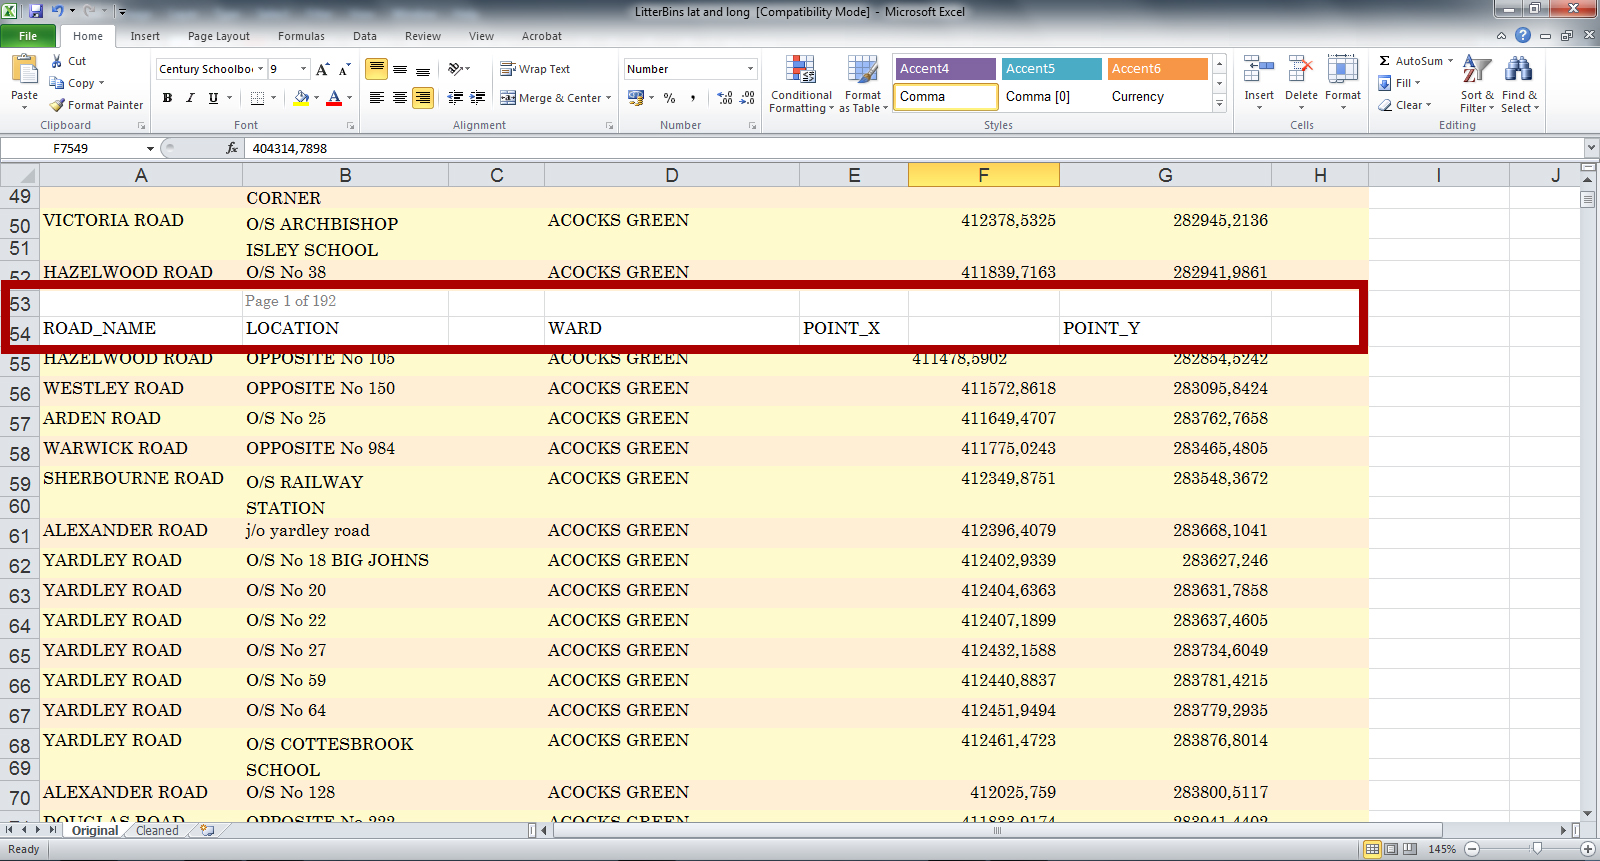
We want each pair of coordinates to have a location description that occupies a single row.
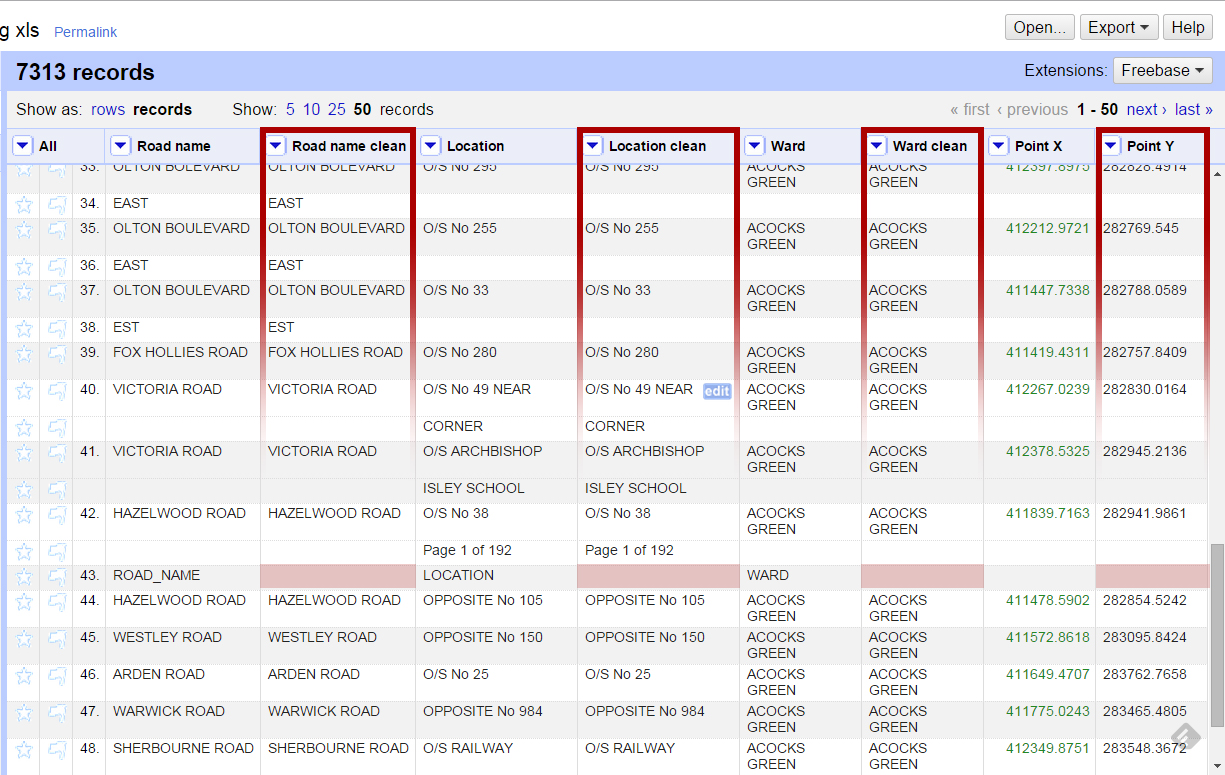
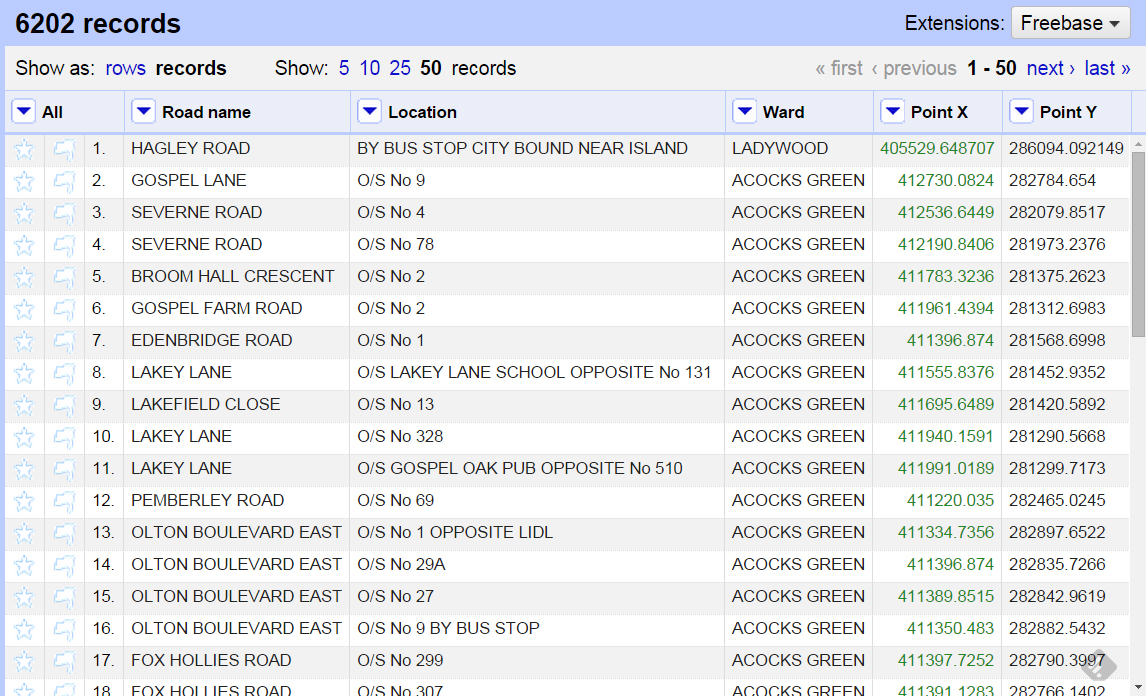
OpenRefine is specifically designed for problems like this. We import our file and we parse our first two rows as column headers. We then delete empty columns and rename the rest accordingly. In the end, our table looks like this:

Removing recurring headers
We should start removing header names that keep repeating.
Most obvious would be to find each ROAD_NAME string and delete it. However, it’s best practice to create a separate column with the cleaned data so that you can always return to the original in case of a mistake.
Left click on the drop down menu of Road name and Edit column>Add column based on this column… We will give our new column a new name and use an expression to replace ROAD_NAME with nothing:
value.replace("ROAD_NAME", "")
We do the same for Location, Ward and also remove the recurring POINT_X from the last column by applying the above expression in Edit column>Transform.
Joining rows
Some of our cells have multiple rows and multiple values which we need to join. But first we need a reference, a column that has one row for each corresponding entry. In our case, it’s Point X or Y so we move one of them at the beginning.
For each cleaned column we go to Edit cells>Join multi-valued cells… We’ll be asked for a delimiter, a character that marks the beginning of a new value, which in our case is a blank space; so just hit your space-bar. After that we delete the old columns.
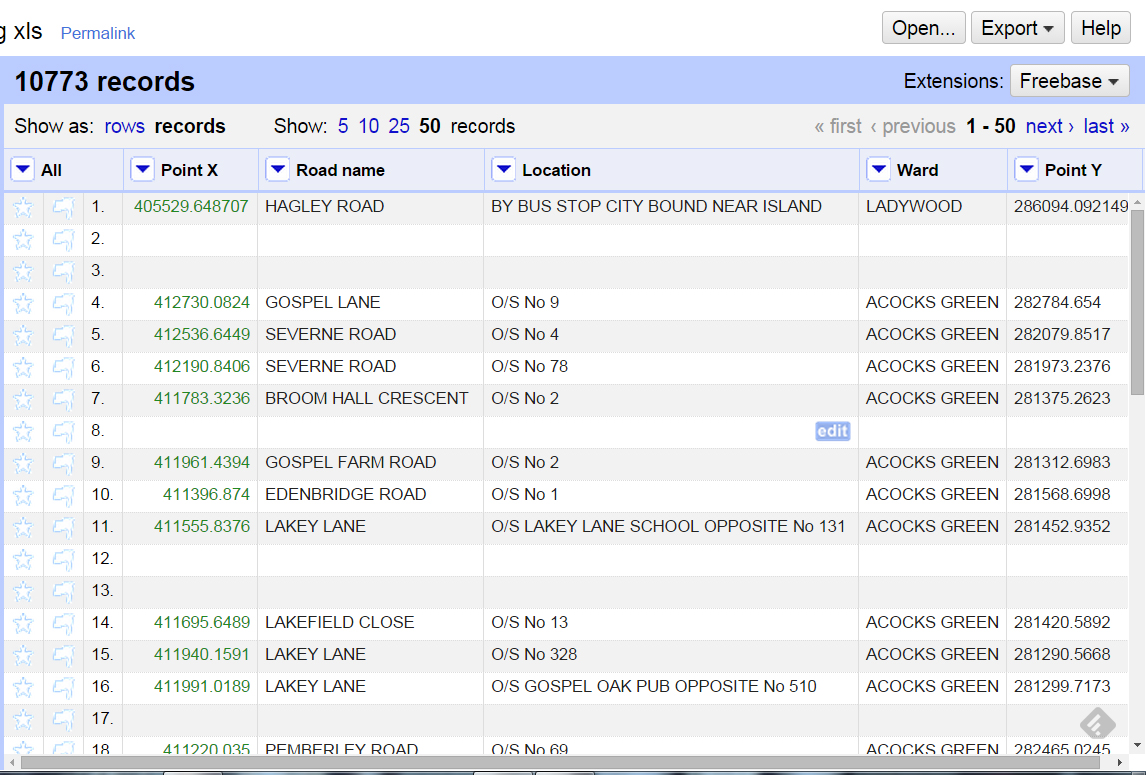
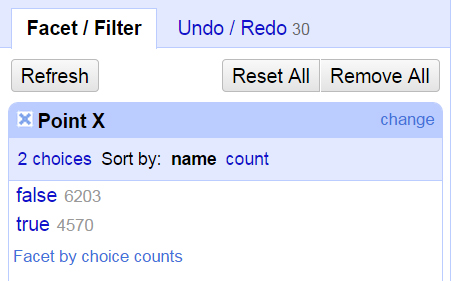
We’re almost done. As can be seen, empty rows remain where the old values were deleted. This is why we move Point X to the beginning. All we need to do is select Facet on Point X, Custom facets>Facet by blank. A Facet works much like a Pivot Table in Excel. We’re telling OpenRefine to display the value count of a column. In this case, I’ve asked for blank cells so a window in the left will display True of False. We can now select the True entries so we have all of Point X’s blank cells as well as the rows that go with them. All we need to do is select all (drop down from furthest left), Edit rows>Remove all matching rows.
Oh no! All of your data has disappeared! That’s because OpenRefine is still displaying blank rows, of which there are none. Just close the facet window from the left and now you can see all of your data is nice and clean.
OpenRefine is a powerful tool for doing this sort of work and contrary to popular belief, one needn’t learn all of it. Just use what you know and look up what you don’t.
Something extra
The table looks good however some cells from Location still have the page numbers on them. If you want to take it further, you can get rid of these so that the addresses are completely clean.
To do this, we’ll have to use something called Regex. What we want to delete has the form of Page [number] of 192. We can instruct OpenRefine to look for structures such as this because it is a regular expression (reg-ex). Regex allows the defining of strings that follow a given pattern. A list of commands is here.
So, we make a duplicate of our column where we apply Transform on it’s rows and we use the following formula:
value.replace(/\sPage\s\d\d?\d?\sof\s192/, "")
And here’s the explanation:
[edge_animation id=”7″]
I downloaded the XLS file from, but it seems incomplete. It only has 164 rows though your screenshots suggest many more. Is it intentionally clipped or a mistake somewhere?
Hi,
The file is intentionally clipped so as to give you a small preview.